Difference between revisions of "5.3 Data Quality Issues"
| Line 48: | Line 48: | ||
<big>Y-axis represents the case count shows results for last 6 months.</big> | <big>Y-axis represents the case count shows results for last 6 months.</big> | ||
| + | |||
| + | |||
| + | [[File:dqi graph.png]] | ||
Revision as of 00:49, 6 January 2015
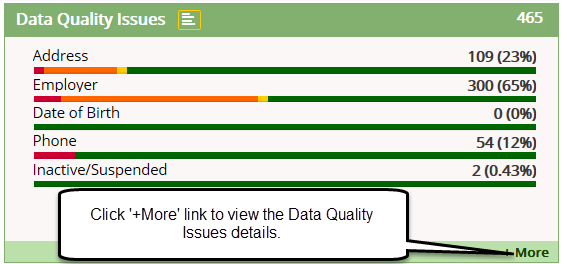
The Data Quality widget allows worker to view the cases that having issue on data quality which assigned to the worker. On the top right side of the Data Quality widget, the worker can view the case count which has Data Quality Issues.
Summary List:
- Address
- Employer
- Date of Birth
- Phone
- Inactive/Suspended
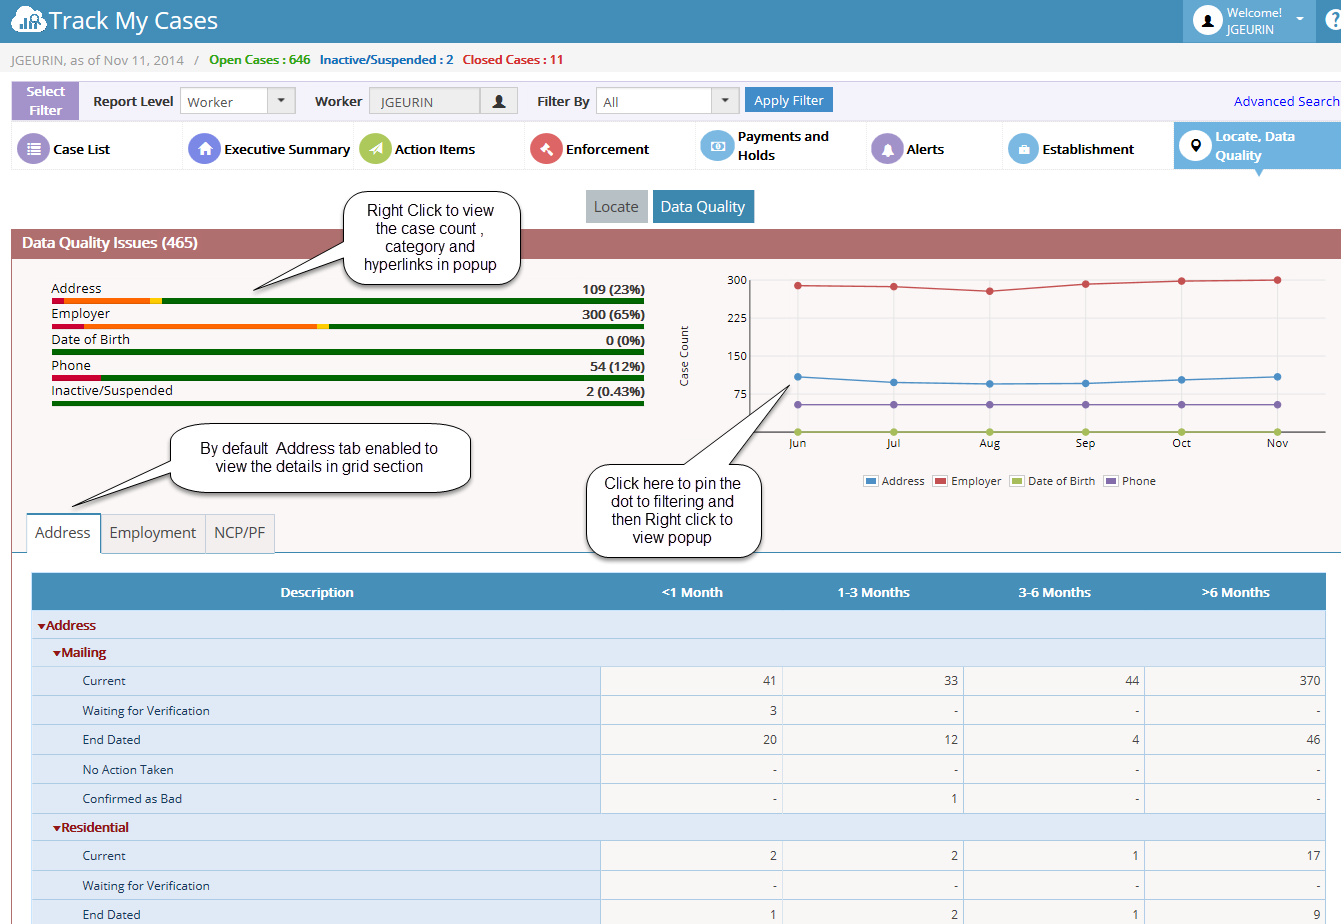
Detail View:
- Address
- Employment
- NCP/PF
On clicking the ‘+More’ Link, it will move to the Data Quality section.
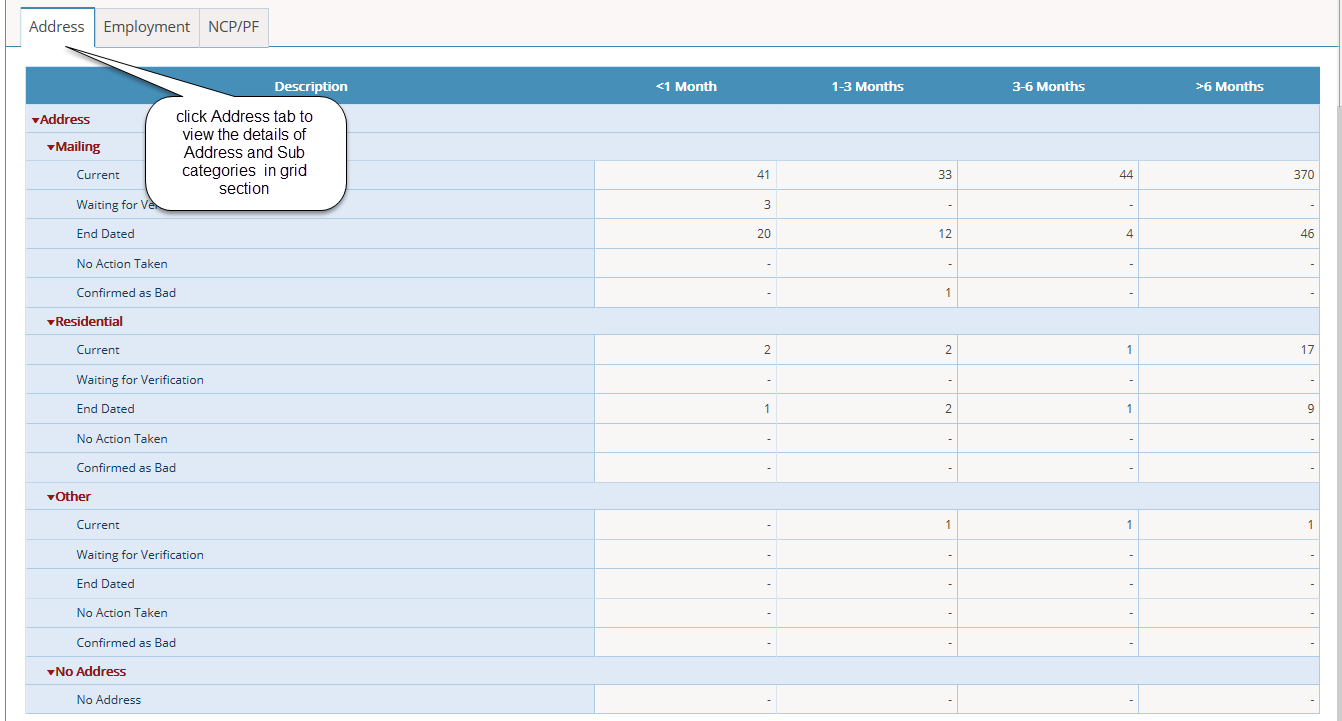
Address:
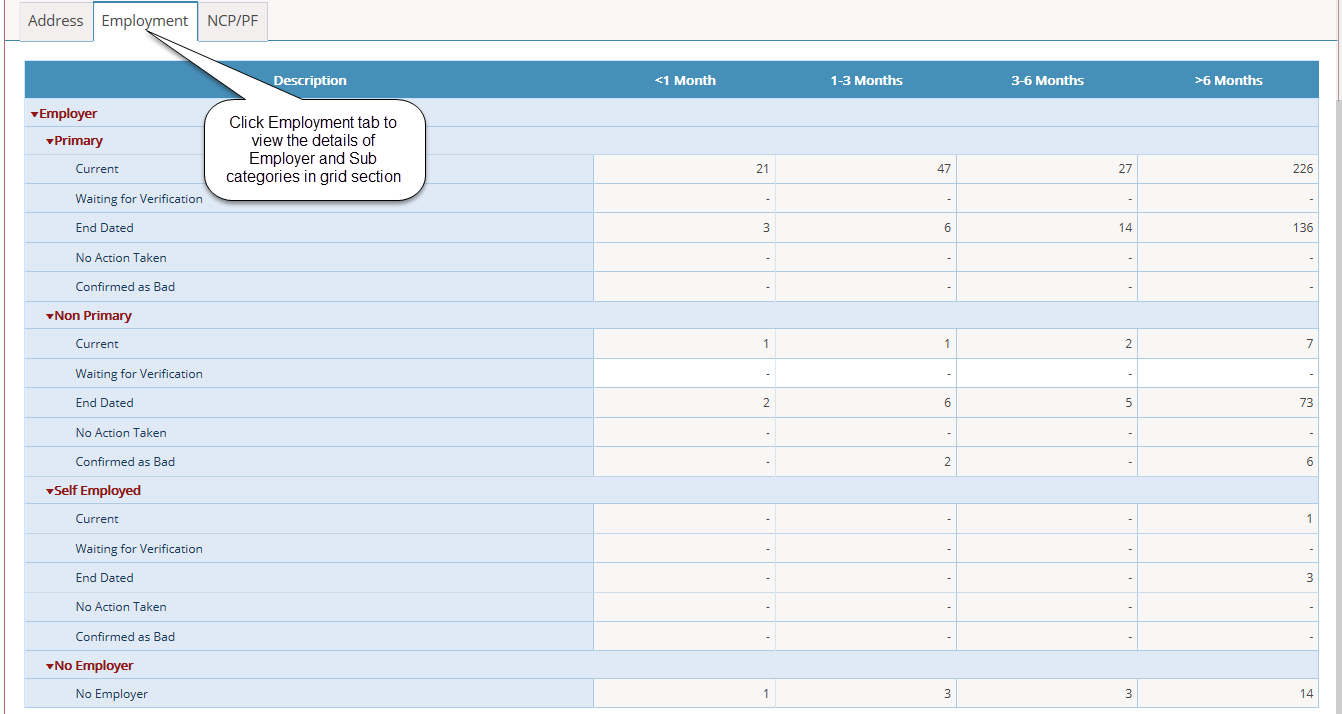
Employment:
NCP/PF:
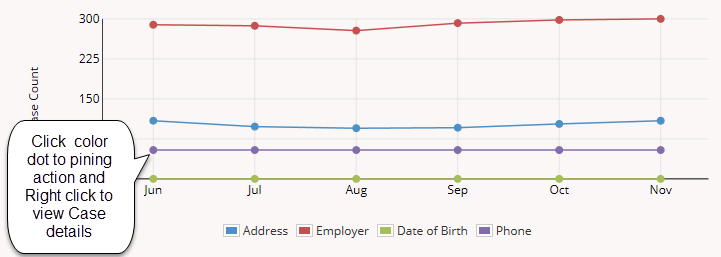
DQI – Graph:
X-axis displays the Last 6 months.
Y-axis represents the case count shows results for last 6 months.

